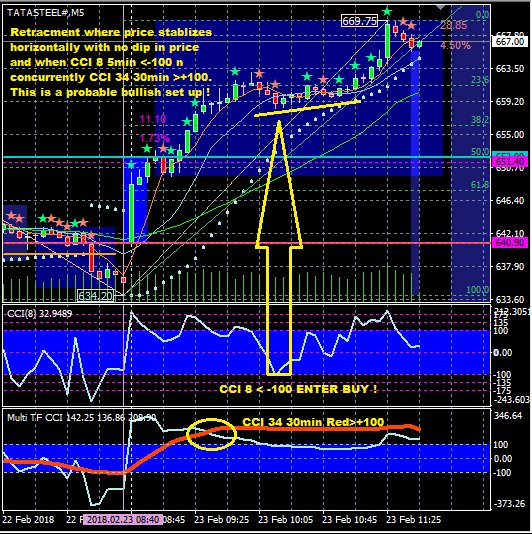
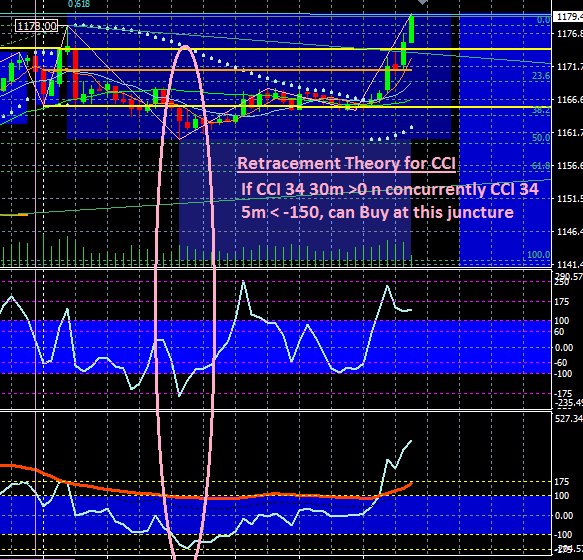
Retracements are fun to work with when the stock moves in a direction with higher time frame as CCI >100, but on the lower time frame CCI fizzles out to <100
Thumb Rule
1) CCI8 (<-100)
2) CCI34 45-60 ( Buy Hold) or more is an approximation
3) HTF >100 (W and M).
1) and 3) are must,
2) can vary here and there
For Intraday
| CCI(8) 5m |
CCI(34) 30m |
CCI(34) 5m |
Description |
| >+100 |
>+100 |
>+175 |
Extreme Bullish / Flat Retracement |
| >-100 |
>+100 |
>0 |
Bullish |
| <-100 |
>+100 |
<-100 |
Wave with Amplitude |
The same conditions can be extended to other timeframes as well example:
| CCI(8) D |
CCI(34) HTF (W/M)
|
CCI(34) D |
Description |
| >+100 |
>+100 |
>+175 |
Extreme Bullish / Flat Retracement |
| >-100 |
>+100 |
>0 |
Bullish |
| <-100 |
>+100 |
<-100 |
Wave with Amplitude |
Summary
How to differentiate if its a Retracement?
When CCI 8<-100 but price abv ORB High n when CCI8>+100 price abv prev high!
Note the Close >EMA34

Positional Setup

Imagine it to be a short circuit, the 3 EMA must not touch, but come close enough to start a new trend during CCI 8/34 conditions, here the green candle at the end comes to the rescue.

Short circuit happened (w.r.t. the 3 EMA as they crossed each other) and retracement never happened in #ADANIPORTS

Around 170-150 can be next retracement picks based on my interpretation

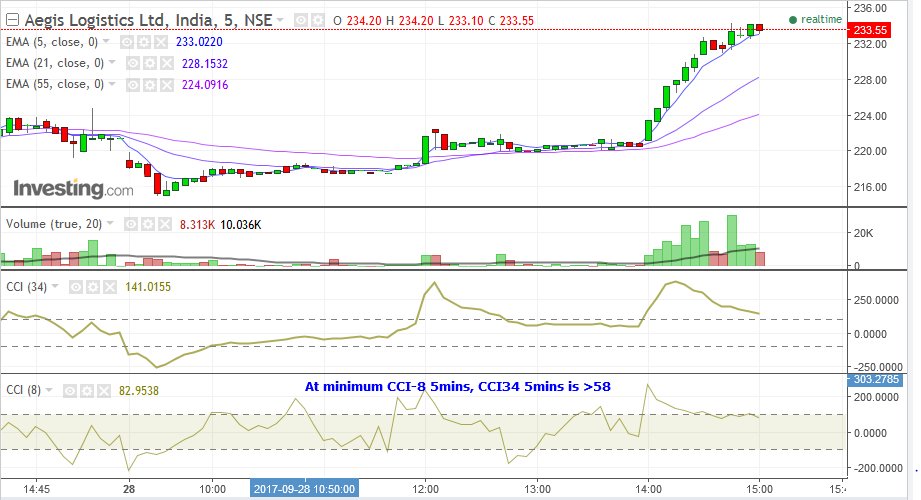
Intraday Setup

Rule
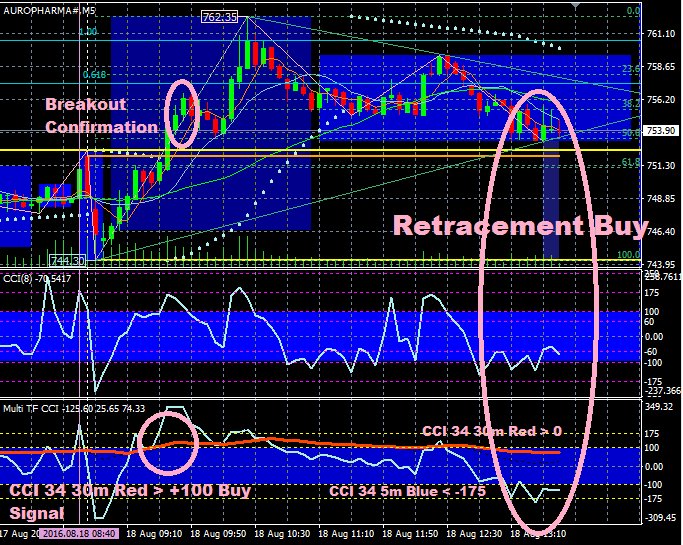
1) At the time of breakout if CCI 8 5M >+175, donot enter and wait for retracements
2) Don't believe in waiting been Stopped Out. 2 consecutive near full body fall candles enough to exit on retracement.
3) Rule is to wait for retracement unless it is cross over abv prev day high! Then bet next 1/4th

BPCL .. was a Classical Retracement Buy at the early hours of the open session .. a case study ...Notes Day Trading

Another classic retracement on #HUBTOWN

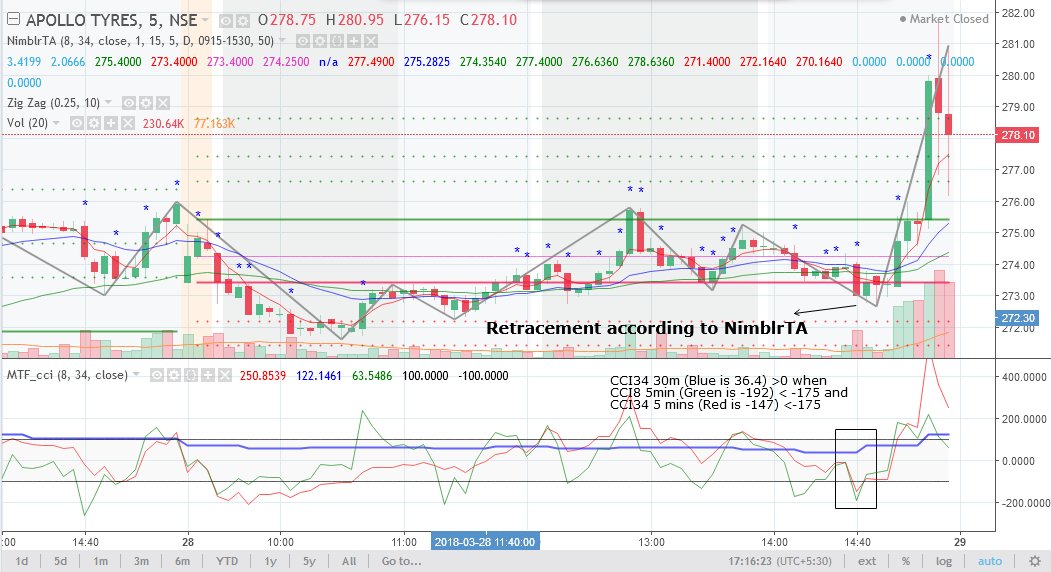
'Near' Classic Retracement observed on Apollotyres
ONGC ..a case of retracement buy in a open range breakout stock for the day


Completes retracement

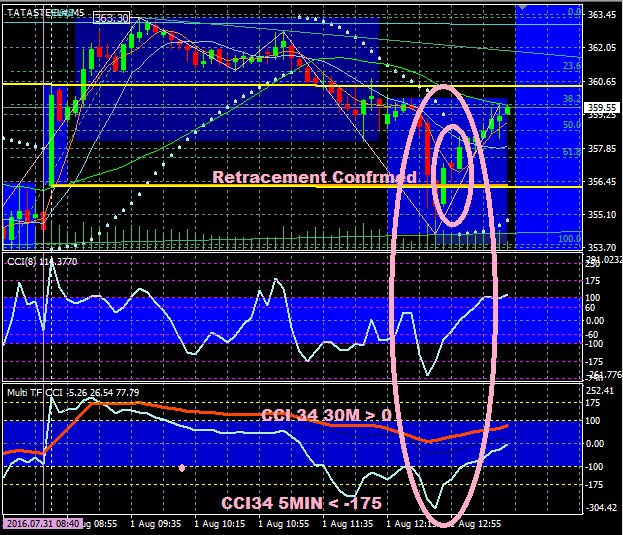
Retracement confirmed


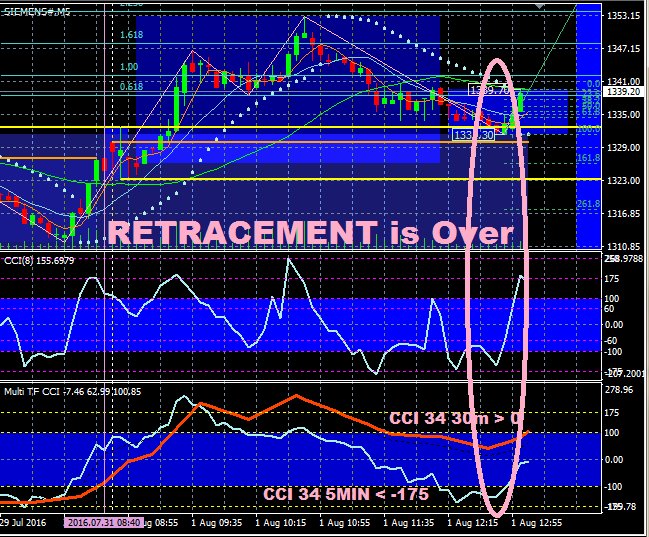
Retracement complete

Retracement complete

Nifty .. about to complete retracement ... nxt 3 candles will confirm this


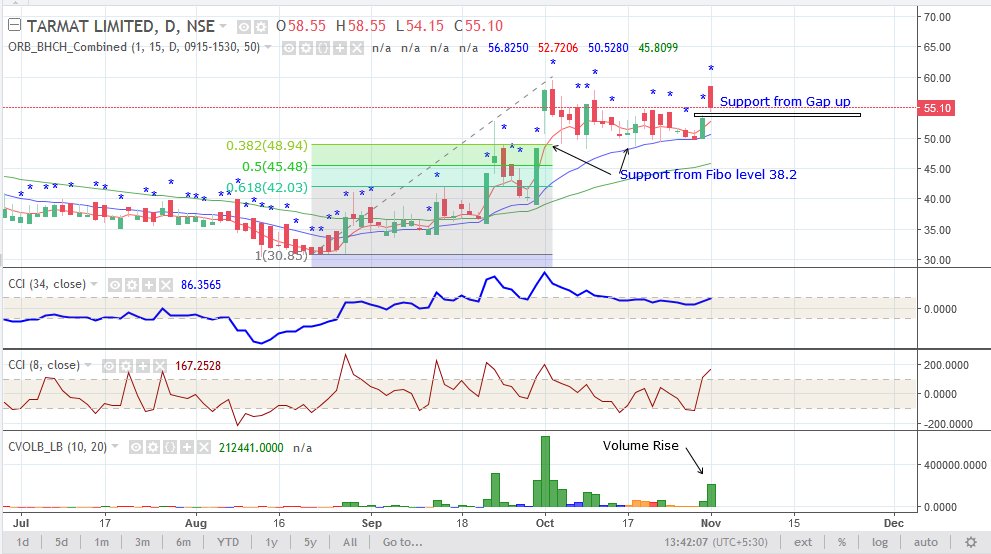
Retracement from Fibo Support with Spinning top, now forming higher lows

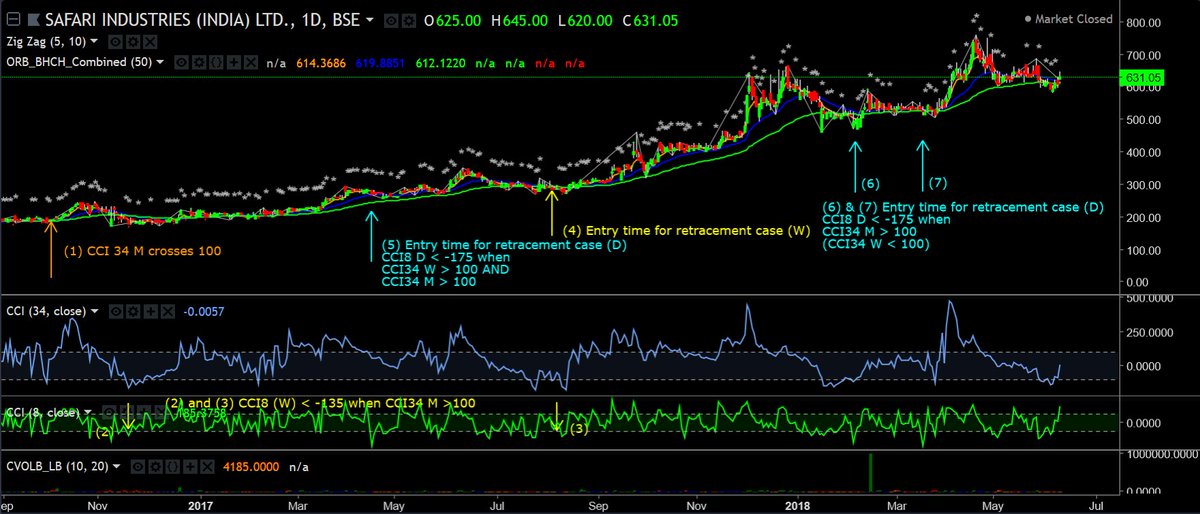
Immediate Buying of course is never to be done. We have Entry Exit rules based on CCI 8 Daily >+175 for Sell and < -175 for Buy! This can mean Buying in desirable Price Range. For CCI 8 Weekly >+135 or <-135.
Note: CCI(Monthly) must be >100 as in this case of TVS Electronics as depicted
CCI8(D) < -175

CCI8(W) < -135

Buying when CCI34(Monthly) >100

Refer M (Orange) (1) W(Yellow)(2)&(3)&(4) D(Blue)(5)&(6)&(7) markings.
Observations:
- CCI34 values vary on retracements for D(53,-104,-34 at marked points 5, 6 and 7)/W(22 at marked point 4), but the key driver is CCI8 D (<-175) and CCI8 W (<-135) for entry.
- CCI(HTF) must be true - Weekly AND/OR Monthly (Markings at points 4,5,6,7 for higher time frame momentum) 6 and 7 have only M momentum while 5 has W and M momentum
Monthly Chart

Weekly Chart

Daily Chart
CCI(W) crossing below 100 gives sideway action unless restored by fresh momentum

Support from EMA Analysis
Many a times the support from an EMA can be a critical factor for investment.

Factor:
- Fundamentally, an excellent stock
- Low float
- Historically price takes support on 55EMA
Comments (7)
Siddharth Khunteta said
at 5:31 pm on Mar 16, 2018
In intraday setup for Retracement certain rules have been provided (please confirm if the understanding is correct, as some ambiguity in language):
"Rule
1) At the time of breakout if CCI 8 5M >+175, do not enter and wait for retracements
2) Don't believe in waiting been Stopped Out. 2 consecutive near full body fall candles enough to exit on retracement.
3) Rule is to wait for retracement unless it is cross over abv prev day high! Then bet next 1/4th"
Understanding: 1) Even if you find CCI B + BO, do not enter if CCI 8 5 min > 175. It can fade out...
2) If one does not want to wait till SL being hit, make an exit if you find 2 consecutive near full body candles of the opposite direction. (Is this understanding right?)
3) Does this require buying on retracement only when previous INTRADAY high is broken ?
Siddharth Khunteta said
at 6:21 pm on Mar 16, 2018
Many a confusions with Retracement on Intraday timeframe: (Please help clear them)
P.S. Do consider a layman and answer these queries, please bear if found me ignorant on any topic.
Siddharth Khunteta said
at 6:21 pm on Mar 16, 2018
1. In the table provided, CCI 34 30M is >100 for all the three conditions. Whereas in charts shown for example, CCI 34 30M is required to be greater than 0 and not 100.
Siddharth Khunteta said
at 6:22 pm on Mar 16, 2018
2. In most of examples, 2 conditions are prevailing : CCI 34 30M >0 and CCI 34 5M < -175. In one example of ITC, only CCI 8 < -100 was there and CCI 34 30M>100, but CCI 34 5 min was not less than -175.
Siddharth Khunteta said
at 6:22 pm on Mar 16, 2018
3. What all conditions are mandatory for retracement buy?
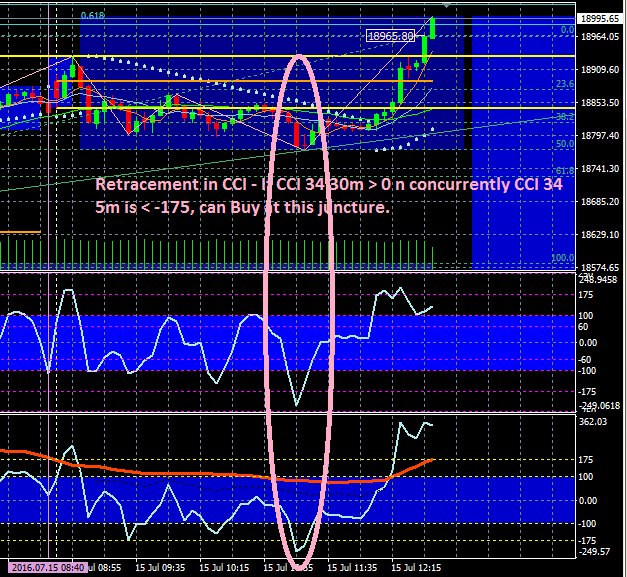
CCI 34 30M>0 and CCI 34 5M<-175 (sufficient enough? as in most of the examples these 2 conditions have been focused upon) Then what is the role of CCI 8 5M ?
Siddharth Khunteta said
at 6:22 pm on Mar 16, 2018
4. Do we also need to check price action once CCI requirements are met ? or we can make an entry only on the basis of CCI requirements getting fulfilled ? (As in most of the examples we have focused on CCI. In 1 example of Nifty, you have mentioned “retracement about to complete…next 3 candles will confirm this…” What confirmation do we need in next 3 candles ? (Strength Candles ?)
Siddharth Khunteta said
at 6:28 pm on Mar 16, 2018
5. In Summary, you have mentioned :
"Summary
How to differentiate if its a Retracement?
When CCI 8<-100 but price abv ORB High n when CCI8>+100 prcie abv prev high!"
Did not find this getting addressed in most of the examples as ORB high have been breached during the retracements. May be I am not getting what is being tried to convey.
You don't have permission to comment on this page.