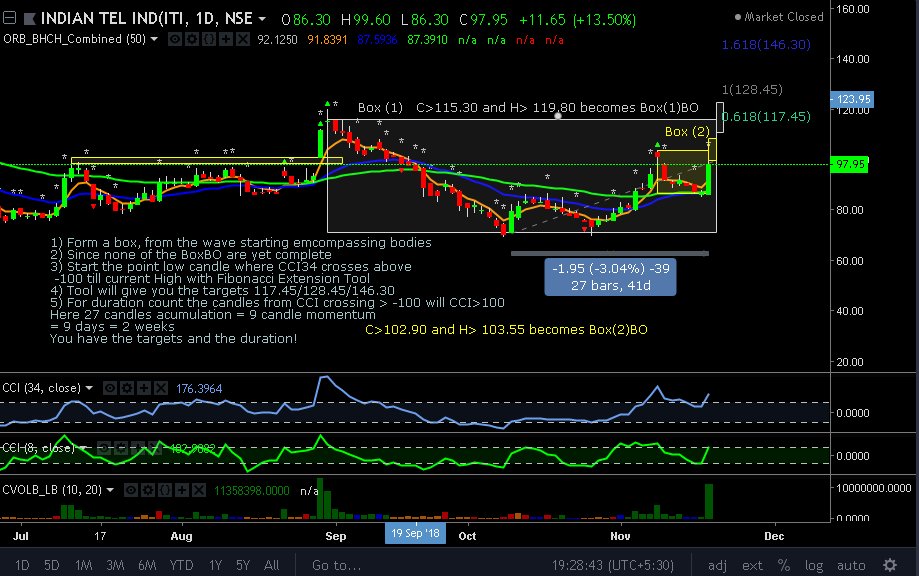
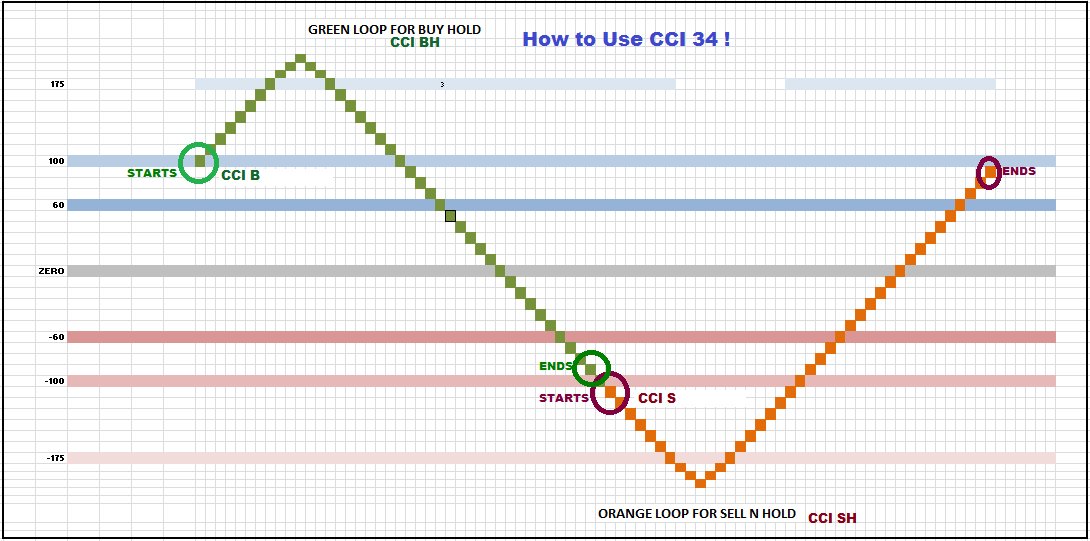
CCI Cycle
Accumulation Time
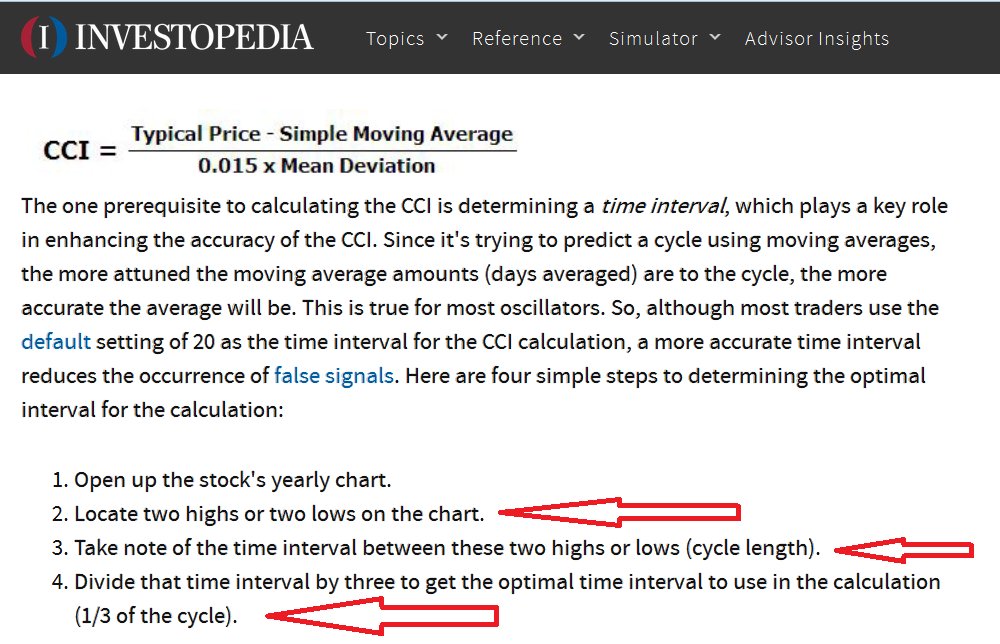
Duration of the stock it spends between 2 CCI peaks / lows is the CCI period
This indicates that CCI34 took some duration to reach the same state (indicates the peak when crosses >+100).
Momentum Time
This is CCI34 powered with >+100 and is 1/3 (Accumulation Time)
Time is 1/3rd the accumulation time + CCI 34 Peak/3 as per CCI theory
In momentum price takes just one third the accumulation time to peak.
The arrows marks the accumulation time, 1/3 of it becomes the momentum time.
This means, if accumulation takes 1 year then momentum peaks in 4 months. (12/3=4)

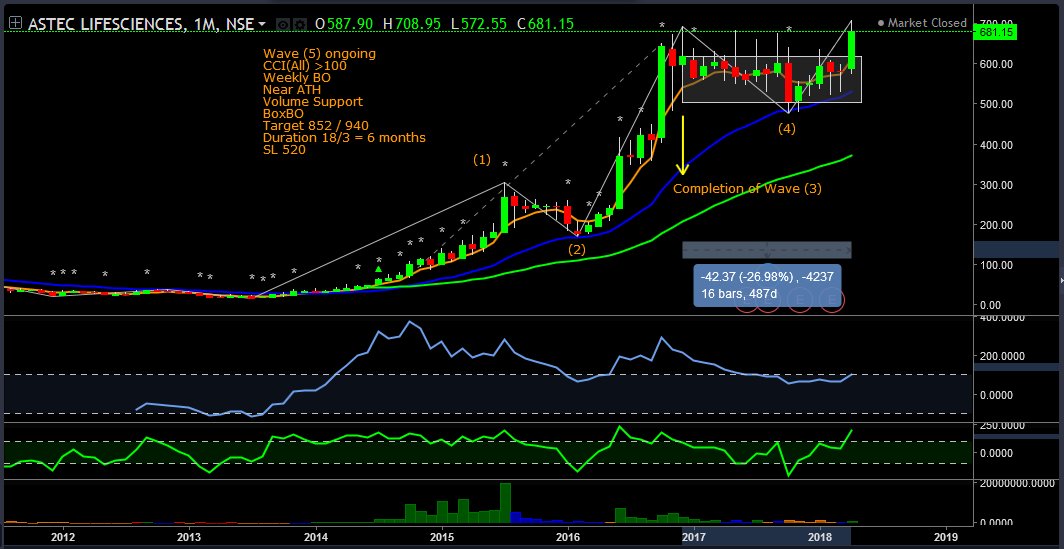
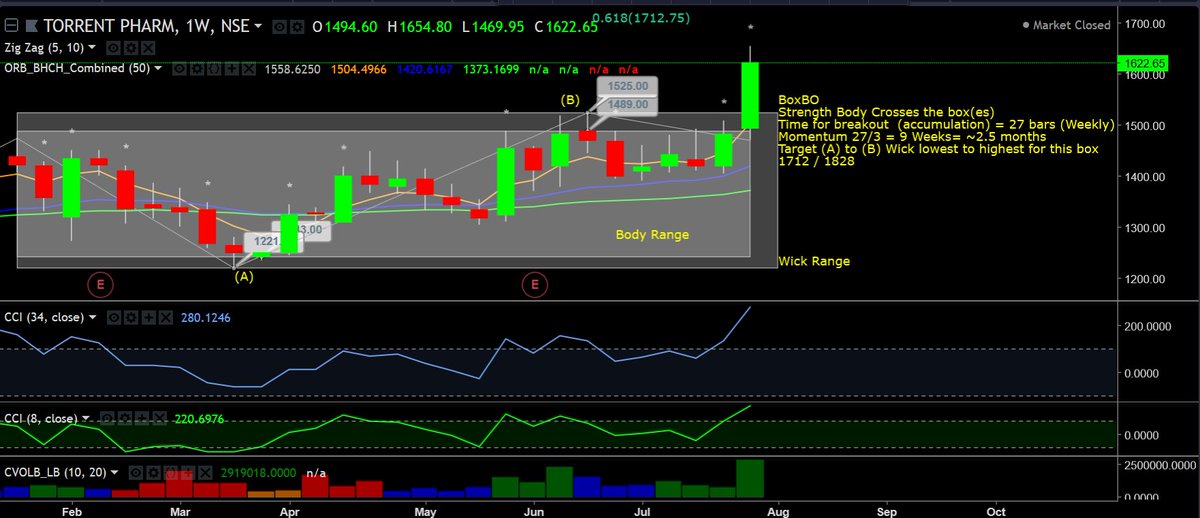
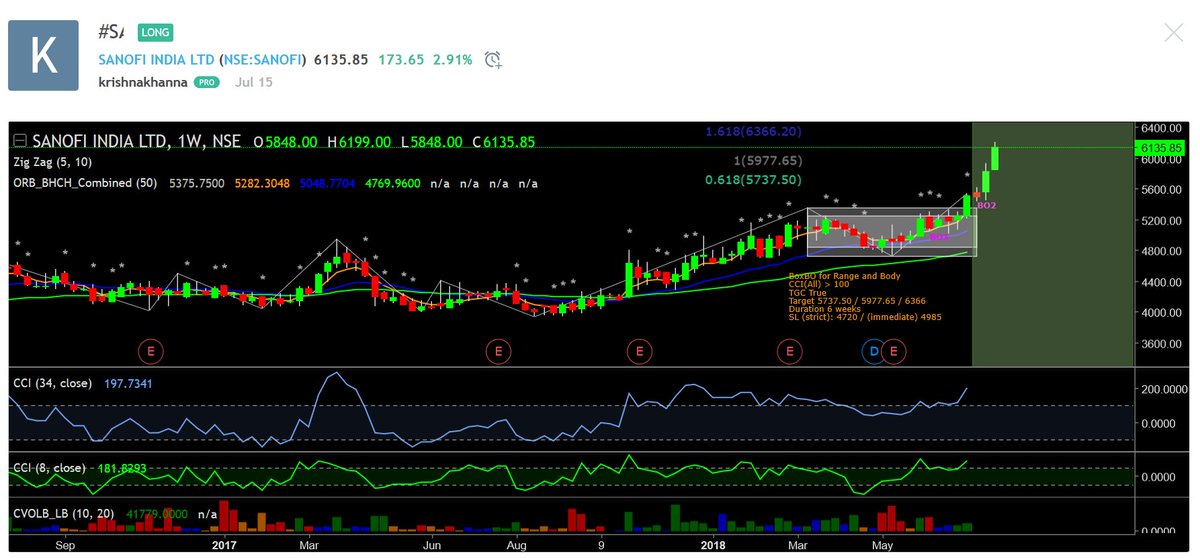
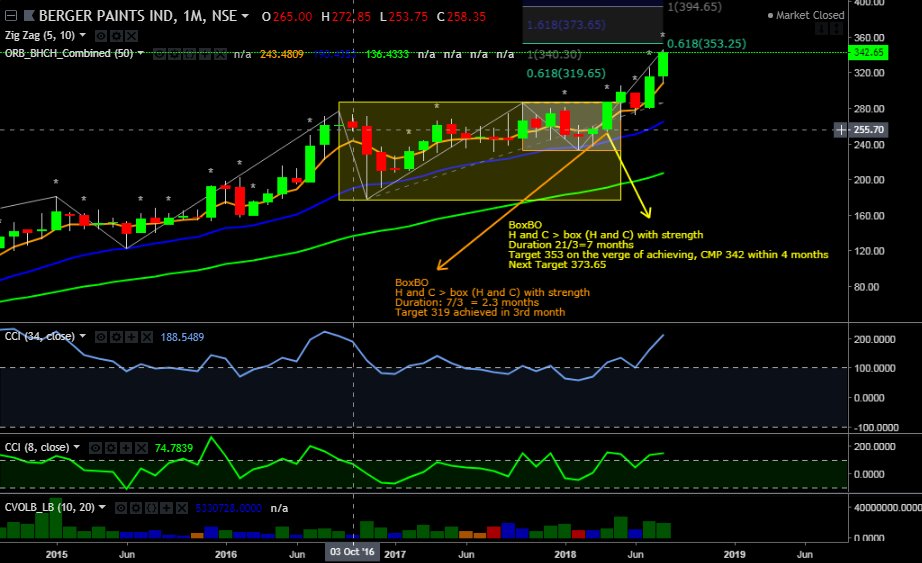
Two different Boxes are drawn on price and on CCI. Here referring to price action for identifying accumulation zone. CCI box to identify the wave.
Our rectangle box should include price action after wave (3)
Peak of (3) is included but not candles prior to that.
It because it starts a new cycle from wave (3) top.
Qn: Then which one is apt for time duration calculation, do we consider common union between the two boxes, that is on CCI and price candle body enclosures? How to correlate these?
Ans: Time duration calculation .. in between Top/Bottom and vice versa. No union here. One is to identify accumulation zones and other for waves.
Qn: Is this marking a correct depiction? Marked the Price Action here after wave (3) completion (including the top of wave (
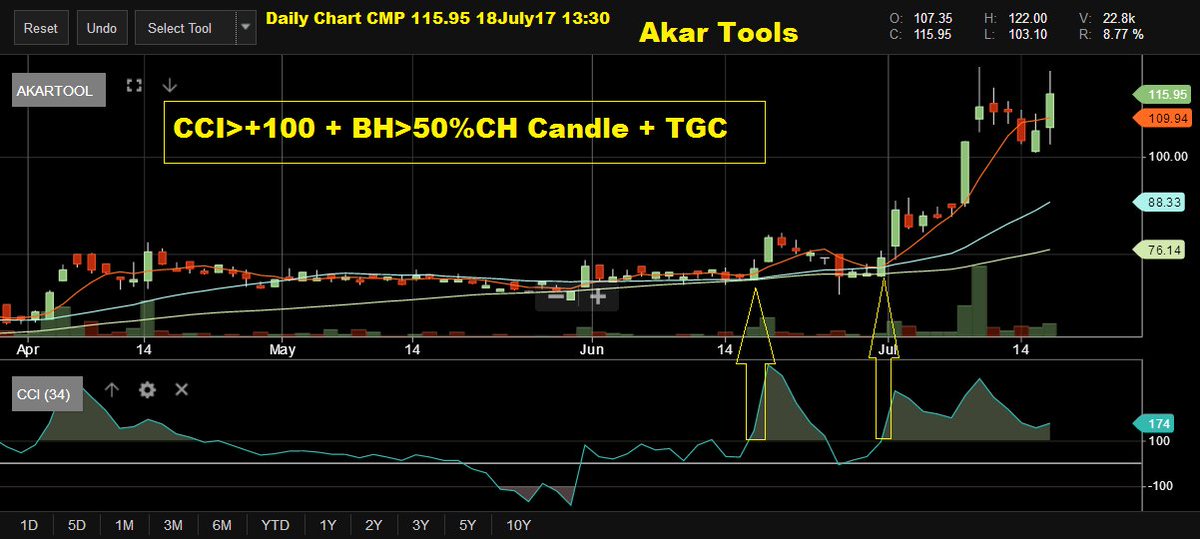
Refer to to the box drawn in the image
Ans: Yes ! one of the first condition of a Breakout is - "Breakout is a Body Breakout from the Range of the Body". Its seen here. Second the high and close is the highest as a confirmation of all the candles in the range.