Reversal confirmation means
1) 2 BH>50%CH are formed


Importance of Two Consecutive BH>50%CH Strength Star Candles for reversal or breakouts. So no weakness observed


Reversal confirmation with 2BH>50%CH candle on D and BH>50%CH > prev W high on W

Bottom Formation
Use Reversal conditions with CCI>100 to get Bottom Confirmation + Momentum

Bottom 1280 Confirmation was completed with BO1 + BO2 on 10Nov17. Moment that was done ... Stock has spurted from 1536 to 1850

Bottom formed on Daily Chart !

Awaited bottom confirmation

Saregama CMP 764.95, Need a BH>50%CH Candle with a High and Close above 790 on Daily Chart for a rise to 915


BIOCON Case
Biocon CMP 659.95 Any Close above 678 with a Breakout (i.e. BH>50%CH) Candle, rise to 761 1mth SL 589 26May18 22:54

BIOCON Reality
Biocon CMP 649.00 ... has not managed to close above 678 and there has been no Breakout too ! In addition there occurs two consecutive BH>50%CH down side strength candles which is a confirmation of Top ATH 683.00 for a few weeks till momentum picks up again. 1Jun18 23;55

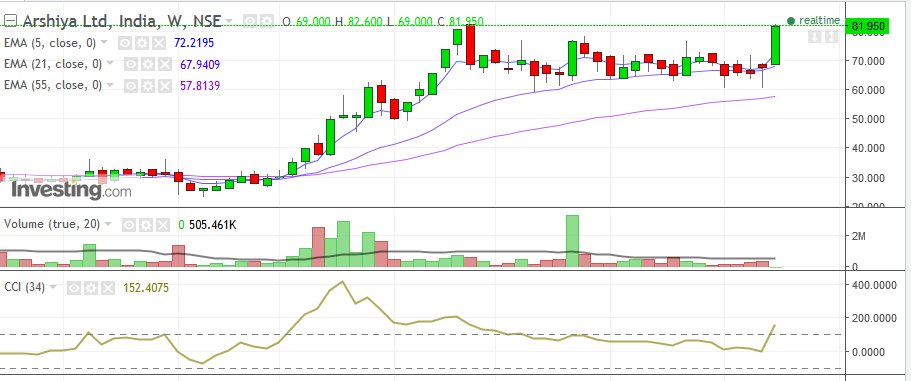
LUXIND Weekly Top Confirmation

Summary:
Time for exit
2 red strength candles confirms the top 2094
Momentum drops below 100
Next could land towards 1550
CCI (D) reaches sell mode
Correction:
LUX Industries ... SL below the top Indecision Non-breakout Candle would have been perfect exit. It's the reason why at the end of the month one shd check CCI 34 Mthly < 100 and watch the switch of strength candle direction.
Re-Analysis in Depth
Zooming to Daily charts, this is what you mean. Please correct me in my understanding. Co-relating D/W charts
Daily Charts
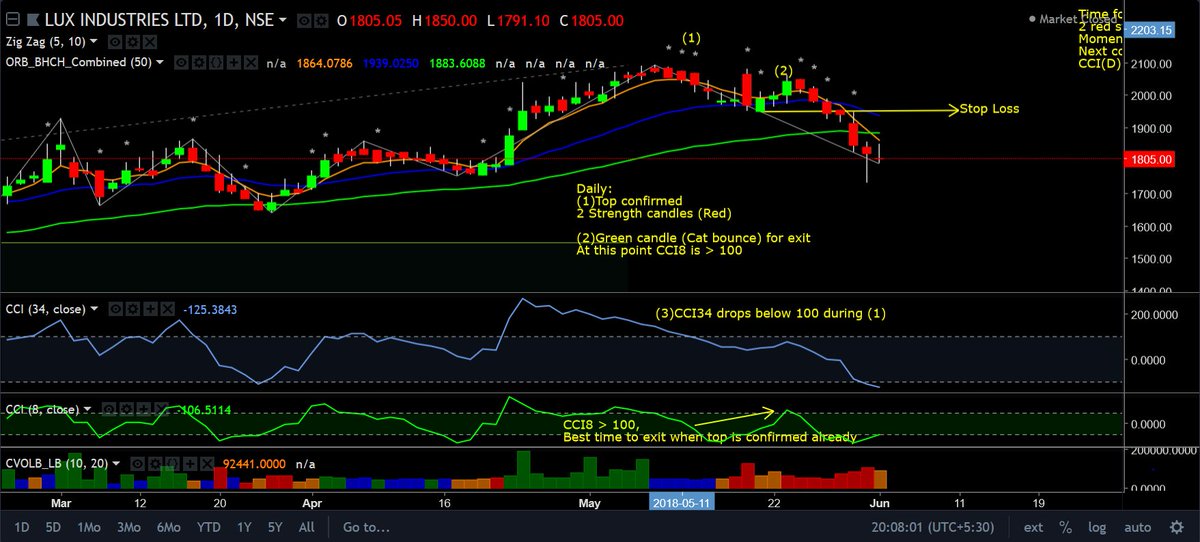
Daily chart ... the same Ambulance sign look-alike candle with ATH 2094 and Low 2067.95 less approx. 2% = 2026 (SL) on daily time frame.
Weekly Charts

Weekly chart ....the very top small tiny Ambulance sign look-alike candle - market sold heavily when crossed below the low 2035.
Qn: How would we interpret 2 red strength candles on D charts only (BIOCON) and W charts (LUXIIND). Does it mean for LUXIND the damage is major and is now spread from D to W timeframe confirming the weekly top while BIOCON has damage on D charts as of now?
Ans: True, exactly as you hv interpreted unless in the same time period in which the fall occurs the prices climb back to where they were.
Comments (0)
You don't have permission to comment on this page.